When I first started this journey bringing my data and climate interests together, my first thought was to look at my own personal data. I happen to have Tesla solar panels and Powerwall, and a Tesla EV. I figured that a high-tech company like Tesla would have a robust, well documented API for accessing data. I was wrong.
Tesla does have APIs, but they are not public, and not documented at all. So I took to the web and found a few industrious souls that have reverse engineered certain aspects of Tesla’s EV and Powerwall APIs. The best (and arguably only) one is a Python library called TeslaPy.
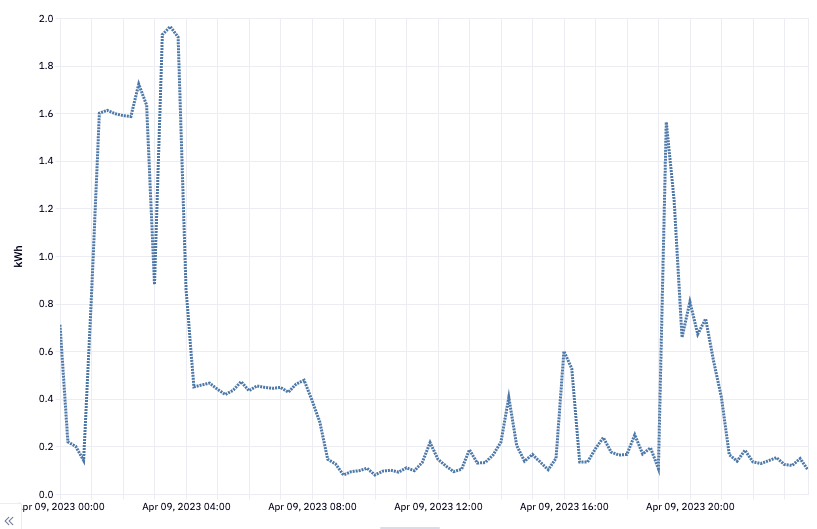
With TeslaPy I was able to access all the historical data related to my solar power generation, as well as the amount of energy I consumed, all in 15 minute increments. I promptly loaded these data into a Snowflake database. When I first started looking at the energy consumption data, I noticed some big, five to six hour spikes in kWh consumed, every few days. Yep, that was when I was charging my car.

My next thought, was to try to net out the energy used to charge my car so that I could get a sense of how well the panels supply normal power needs of my home. Since the Tesla charging systems is so smart, however, it was not as easy as just subtracting the charging rate of the car in kWh. Charging rates can vary depending on a number of factors. Plus, there is no way to know whether a spike is due to the car, or to say, running the dryer, stove and air conditioner all at once.
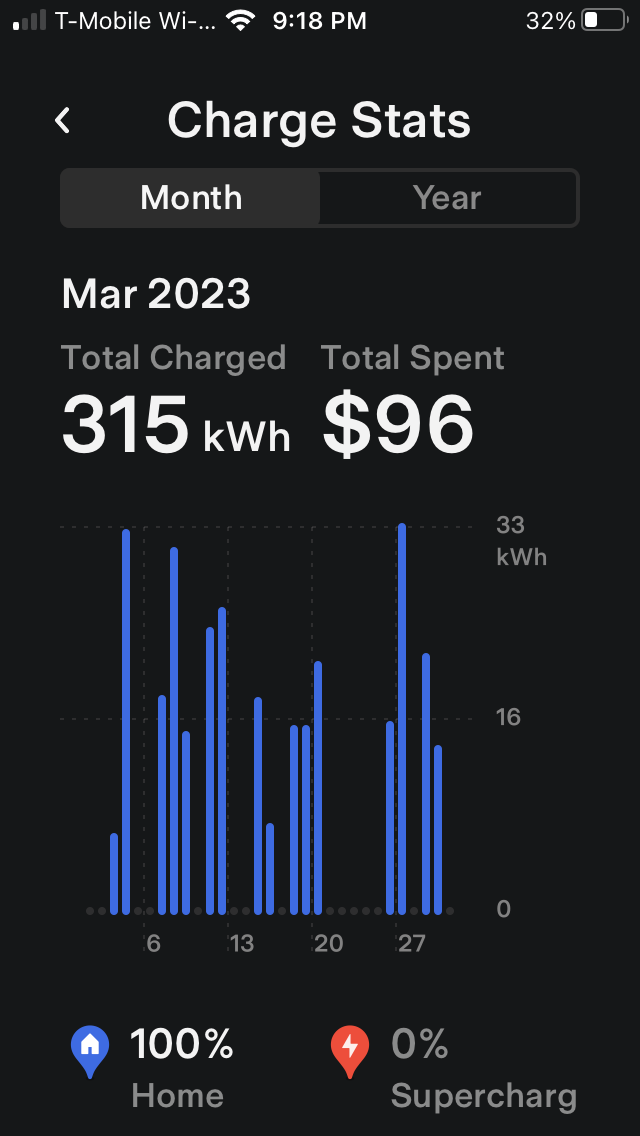
So I turned again to TeslaPy to pull the charging history of my car. But then I ran into a roadblock. TeslaPy would only give me daily charging data back 31 days. I knew that more historical data was available, because I was able to see daily results in the Tesla app.

I just had to figure out the API parameters for setting a start and end date for the data I wanted to pull (TeslaPy defaults to just supplying the last 31 days and does not document API parameters for the charging stats endpoint).
To solve this I used Postman as a proxy to my wifi so that I could intercept the API calls that the Tesla app was making to its API. I won’t get into the details of how this is done, but this is the article that I used. It worked like a charm, and I was able to inspect all the request details of any function in the app - including how to set start and end dates for the charging stats.
Next challenge: the charging stats API gave daily results between the start and end date, and I wanted results down to 15 minute intervals so that I could join it to my consumption data. I tried end dates 15 minutes after a start date, but this just returned zeros, even when I knew the dates were during a charging period. It seemed as though the API expected the start date to be anchored at midnight, but allowed the end date to progress throughout the day, returning cumulative results for the day. But if a charging session happened to cross over midnight, these results would not be included. To solve for this, I had to capture data from a start date forward 48 hours (2 days), then overlap that by setting the next start date the next midnight, capturing forward 48 hours again, and so on. This is the a function I wrote to pull data between a start and end date (assuming TeslaPy has already been used to get an access token).
import requests

def getChargeHistory(access_token, start_date, end_date):
    headers = {
      'host': 'owner-api.teslamotors.com',
      'x-tesla-app-key': '7CB606CDE5B55FAD9AF4350D50924A62F53BB865',
      'accept': '*/*',
      'authorization': 'Bearer ' + access_token,
      'accept-language': 'en',
      'cache-control': 'no-cache',
      'accept-encoding': 'gzip',
      'charset': 'utf-8',
      'user-agent': 'Tesla/4.20.70 (com.teslamotors.TeslaApp; build:1700; iOS 16.4.1) Alamofire/5.2.1',
      'connection': 'keep-alive',
      'x-tesla-user-agent': 'TeslaApp/4.20.70-1700/bc51c2543c/ios/16.4.1',
      'content-type': 'application/json'
    }

    payload = json.dumps({})

    url = "https://owner-api.teslamotors.com/api/1/vehicles/{vehicle_id}/charge_history?start_date="+start_date+"&end_date="+end_date

    response = requests.request("POST", url, headers=headers, data=payload)

    response_json = json.loads(response.text)

    return response_json['response']['charging_history_graph']['data_points']
I just stuck the function call in a for loop that incremented the start dates by a day, and end date by 15 minutes for 48 hours. I saved each iteration of the loop in a Pandas data frame.
I ran this process to pull about two years worth of data (in 15 minute increments). The whole execution took about 5 hours on my MacBook Pro. I loaded the resulting dataset into a Snowflake database table alongside my consumption data. I have since set up a process to auto load data to the database once an hour (that is for a future article).
This is the end result, showing how the charging data nicely match up with the spikes in energy consumption.
As you can see, the two data sources (consumption data from the Powerwall and charging data from the car) line up pretty nicely. Not perfect, but good enough for what I want to accomplish.
In my next article, I will show how I use these data and Random Forest models to predict my net energy consumption over the course of a month.

コメント