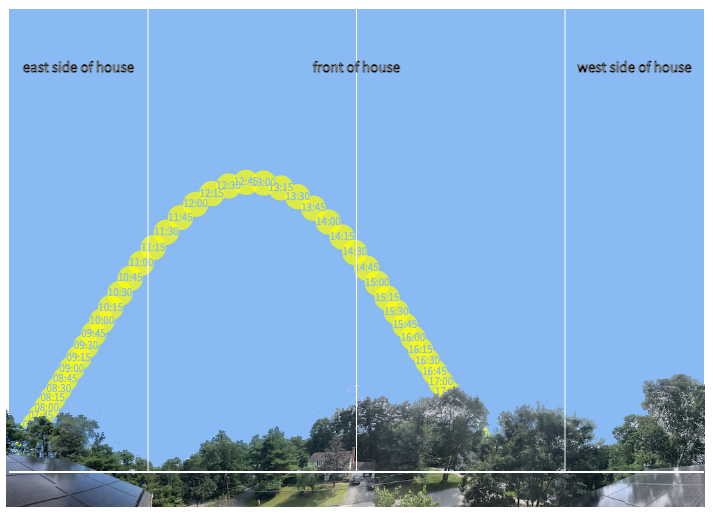
To track the position of the sun in the sky, I showed in my last article that altitude (the angle off the horizon) and azimuth (the angle from magnetic north) can be used. This naturally has an impact on the amount of energy that can be produced by solar panels, but other factors such as the tilt angle of the panels, as well as the compass direction in which they are positioned need to be considered as well.
Every point on earth has an optimal tilt angle and compass direction that will maximize solar energy production. It would be great if solar panels could track to the altitude and azimuth of the sun for their location, but most residential installations are placed on a rooftop, fixed, and often in a less than optimal position (as I illustrated for my house).

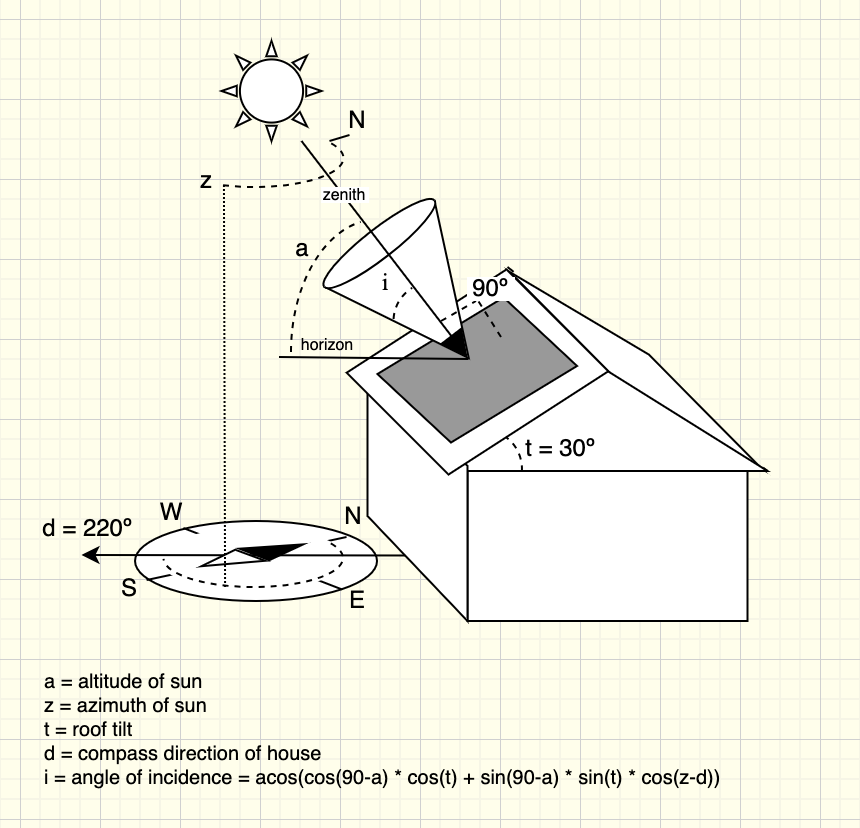
The best angle for solar production is when the sun's position is at a 90º angle (i.e. perpendicular) to the surface of the solar panels. This is called the zenith. For my panels, which have a pitch angle (tilt) of 30º and a compass direction of 220º, the zenith is an altitude of 60º (which is perpendicular to the tilt of 30º), and an azimuth of 220º (which is perpendicular to the front of the house).
As the sun moves out of this position (if it ever gets there at all), the energy from the sun on the surface of the panels will start to reduce. However, this energy can be the same for different combinations of altitude and azimuth.
To conceptualize this, imagine a cone perfectly centered around the zenith, with the tip of the cone on the solar panels. Wherever the sun aligns with any vector on the outer edge of this cone, the amount of sun energy on the panels will be the same. As the base of the cone gets wider, (i.e. the sun moves further away from the zenith) the sun energy on the panels will continue to drop.
The distance from the zenith in this cone is measured with the angle between zenith and the outer edge of the cone. This is referred to as the angle of incidence (i). The angle of incidence is determine by:
The tilt angle of the roof
The compass direction of the house
The altitude at any moment
The azimuth at any moment
The diagram below shows how all of these factors come together to calculate the angle of incidence.

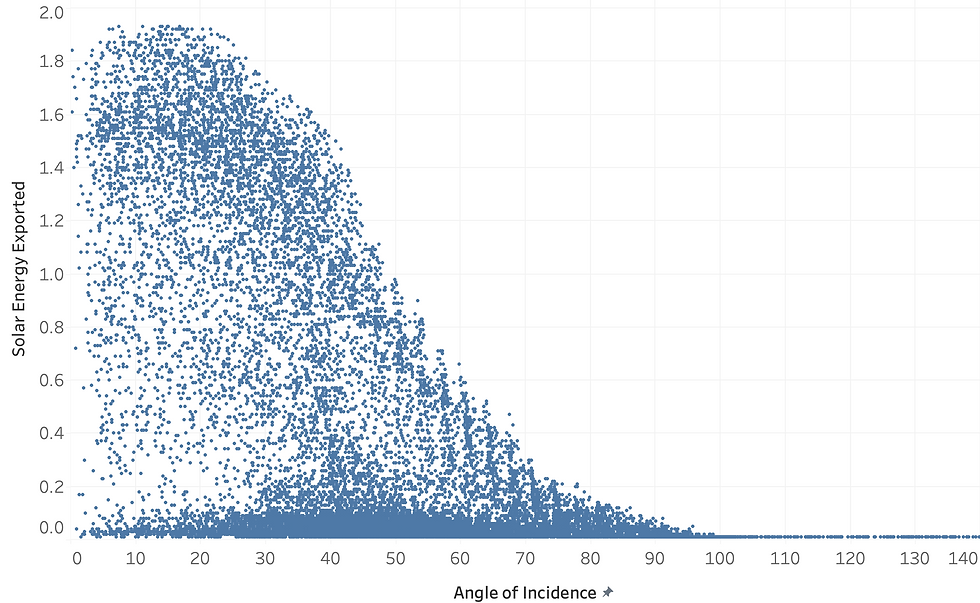
Now that we have the angle of incidence we can study the relationship of it to the actual amount of solar power produced. The chart below shows that there is a pretty clear upper boundary relationship between angle of incidence and solar energy produced - meaning, that for each angle of incidence, there appears to be a maximum amount of solar energy that can be produced. All the dots below this upper boundary represent situations when the production of solar energy was less than optimal. For example, such as cloudy skies, trees, or snow covered panels.

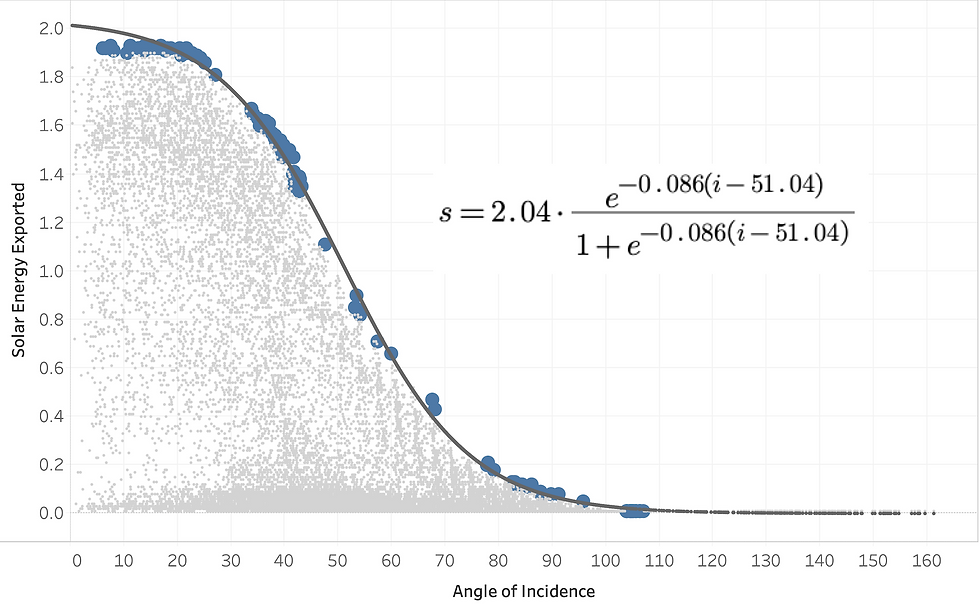
I'd like to understand the mathematical relationship between angle of incidence and maximum amount of solar energy that could be produced, so that I can model how efficiency is reduced in less than optimal situations. I chose a negative sigmoid function to define this relationship:

Where:
S is the production capacity of my solar panels
k is a scaling factor that stretches the curve over the x-axis (angle of incidence)
i0 is the inflection point of the curve
i is the angle of incidence
s is the expected solar production for any angle of incidence i
My solar panels have a rated capacity of 8.16 kW. This means that in an hour of perfect conditions, with clear skies and the sun locked in at the zenith of 60º altitude and 220º azimuth the panels will produce 8.16 kWh of electricity (please ignore the fact that if the sun is stuck in the same position for an hour, then the world has literally stopped).
Remember though that my solar production data are measured in 15 minute intervals, so the electricity produced in this "perfect" time period would be 8.16/4 or 2.04 kWh. Therefore, S for my panels is 2.04 kWh.
In order to estimate k and i0, I plucked data points from upper boundary, and used the curve_fit function in the Python scipy optimize library to fit to these points.

Notice that the largest amount of energy produced on the chart above is just under 2 kWh. This is due to the fact that the altitude and azimuth of the sun rarely gets an angle of incidence close to zero (the zenith), and when they do, conditions are less than optimal.
Now that I have the mathematical relationship between angle of incidence and solar maximum possible solar energy production, I can model how solar energy production drops, or becomes less efficient in response to factors such as temperature, cloud cover, age and physical obstructions. This will be the topic of my next article!

Comments